What are candlestick patterns (and how to read them)
When it comes to trading, the chart in review can be comparable to a treasure map; if that's the case, then the candles are the trail leading to profits.
Of course, any experienced trader will still incorporate other tools, such as technical indicators, to help increase their chances of profiting, but understanding the different candlestick patterns, their meanings, and their role on a larger scale is crucial.
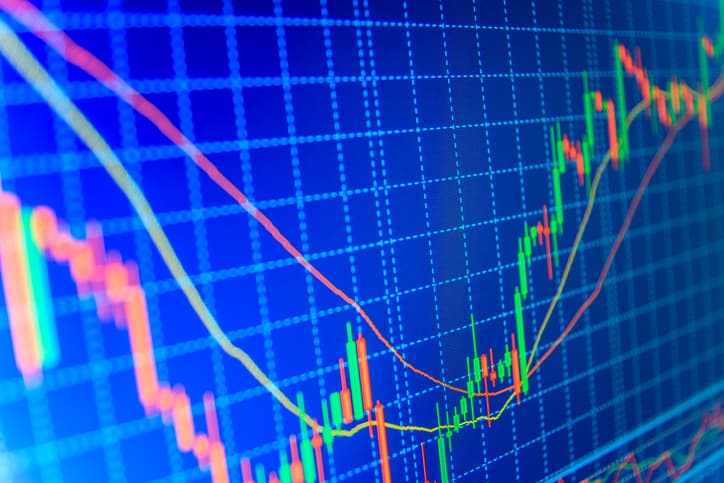
Candles come in different shapes, sizes, and colors, each combination carrying a different meaning.
The basics
While candles can make various shapes and patterns, there are essentially two primary colors, green and red.
A green candle shows enough buying pressure to outweigh the selling pressure for that period.

A red candle shows the opposite: the selling pressure outweighed the buying pressure.

Trading is a game of tug of war between the bulls and the bears. The color of each candle represents who is winning (at the time).
Each candle comprises two sections, the body and the shadow (commonly called a wick.)
The body is the solid part of the candle. The longer the body, the stronger the signal the candle shows; a long green body equals strong buys, and a long red body equals strong sells.
The shadow, or wick, is the thin line that sticks out of the top or bottom of the candle's body.

The wick represents either the highest or lowest price point the asset visited - the top wick would represent higher price levels, while a wick located below the candle body would represent lower price levels.
Many vital parts also make up the body, which depicts the story they are telling depending on the candle's color.
For example, the body's bottom line on a green candle shows where the price started, while the top line shows where the price ended for the duration of the candlestick pattern.
However, the reverse is true for a red candle. The line at the top of the body shows where the price was at the beginning of the candlestick pattern, while the bottom line shows where the price closed at the end.
But not all green and even red candles are the same - each one comes in different shapes and sizes and carries different meanings depending on their patterns.
The patterns
A Marubozu candle is a full-body candle

Japanese for the world bald, Marubozu candles tend to have little to no wicks on either side.
A green bullish Marubozu candle shows that the buyers had complete control of the price action, while a red bearish Marubozu shows that the sellers were in control.
A Marubozu candle, if spotted in the middle of either an uptrend or down trend, usually means a trend continuation.
A trend reversal tends to follow if spotted at the top or very bottom of a trend.
In a bullish closing, Marubozu has a small wick to the downside but a whole green body showing that the bears were once in control, but the bulls had stepped in and taken over.
A bearish closing, Marubozu has a small wick to the upside and a full red body showing that the bulls tried to push price action up, but the bears successfully took over and drove the price action down.
A spinning top candle also comes in various shapes and sizes, but for the most top shows indecision in the market.
Spinning top candles, in a sense, defines a game of tug of war that ended in a tie as neither the bears nor bulls could entirely dominate.
Spinning tops are unique for their short bodies and long wicks (on both sides of the body).
A green spinning top could indicate a bullish reversal if formed at the bottom of a pattern, commonly following multiple red candles.
A red spinning top found at the top of a pattern, usually following multiple green candles, could signal a possible bearish trend reversal.
A hammer candle, also referred to as "single-candle reversal patterns,"
has a very short candle body located at the top with a long wick below the bottom, often at least twice the size of the body.
With these types of candles, color is applicable.
An inverted hammer candle resembles an upside-down hammer with a small body at the bottom of a long, upwards wick.
They both can be found only during a downtrend and represent a price reversal ahead or a strong bounce following a deep correction.
In an uptrend, they are called a shooting star, also a single-candle reversal pattern family member.
Related Articles

Preparing to catch the bottom
Copy trading can be a valuable tool for novice traders looking to catch the bottom of a bear market. It allows users to replicate successful trades of experienced traders and learn from their strategies.

The top indicators used by professional traders
Technical indicators, such as support and resistance, oscillators, and volatility indicators, are crucial for identifying trading opportunities. Traders often use a combination of indicators to find their perfect formula.

Crypto technical analysis: what is it, and how to do it right?
Crypto technical analysis involves studying past price movements to forecast future movements. Traders use candlestick charts, pivot point trading, and Fibonacci retracements to analyze trends and make trading decisions.