Table of contents
- How the order cycle works
- Grid, DCA, or manual ladder?
- Range behavior versus a trend
- Fees and execution quality
- Monitor before judging results
- A low-commitment study path
A crypto grid bot explained simply is an automated order ladder: you define a lower and upper price boundary, divide that span into levels, and let the bot place or replace orders as price crosses those levels. The approach merits study when price repeatedly moves both ways through a bounded area and the net value of completed cycles remains positive after costs. A DCA bot merits evaluation instead when the intended pattern is to add purchases as price falls before a configured exit; a manual limit-order ladder merits evaluation when direct control matters more than automatic fill handling. For a focused side-by-side decision guide, read Grid Bot vs. DCA Bot. This is a trading mechanism, not a profit promise. A range can break, inventory can lose value, orders may not fill as expected, and frequent execution can make costs decisive. The useful question is therefore not “Does automated grid trading work?” but “Do the observed price path, execution quality, costs, and test results support further study under stated boundaries?”
How the order cycle works
Cornix users configure a price range and a grid count How to Create a Grid Bot. Each grid is a potential buy or sell level inside that range, while the lowest level is buy-only and the highest is sell-only. Cornix also documents three spacing methods: arithmetic spacing uses the same price difference, geometric spacing uses the same percentage difference, and custom spacing lets the user define the levels Advanced Grid Bot Settings | Cornix Help Center. A documented Thalex implementation makes the cycling mechanism concrete: it divides the range into levels, puts buys below the current price and sells above it, and - after a buy fills one level lower - resets the adjacent level above as a sell Grid Bots are live on thalex | Crypto Exchange for Futures and Options - Thalex. The reverse cycle follows the same basic idea when price moves down after a sale. This illustration explains the mechanism, but implementation details should not be assumed identical across providers. In plain English, the bot does not predict a destination. It repeatedly reacts to crossings inside boundaries. More levels generally mean smaller gaps and more possible order events; fewer levels mean wider gaps. That creates an operational tradeoff: spacing must be wide enough for a completed buy-sell pair to remain meaningful after applicable fees, yet crossings must actually occur for cycles to complete.
Grid, DCA, or manual ladder?
Primary decision aid: choose the mechanism to study
| Approach | Order logic | Capital deployment | Automation and workload | Strongest fit / weakest fit |
|---|---|---|---|---|
| Grid bot | Orders are distributed across configured levels, and adjacent opposite orders are reset after fills. | Capital is allocated across a bounded set of price levels. | Fill response and order replacement are automated; the user still defines and monitors the boundaries. | Editorial inference - Strongest: repeated two-way execution across configured levels. Weakest: price does not continue crossing those levels. |
| Cornix Smart DCA bot | Purchases continue as price decreases, followed by a configured sale when price rises. | Capital is deployed through additional purchases at lower configured prices. | A new configured trade can be created automatically after a trade closes unless advanced settings specify otherwise. | Editorial inference - Strongest: adding purchases as price falls before a configured exit. Weakest: repeated two-way range trading is wanted. |
| Manual limit-order ladder | Each limit order seeks execution at its specified price or better. | The trader chooses the size and price of every individual order. | The trader submits, checks, cancels, and replaces individual orders. | Editorial inference - Strongest: direct control of individual limit orders. Weakest: fill handling and replacement should be automated. |
Range behavior versus a trend
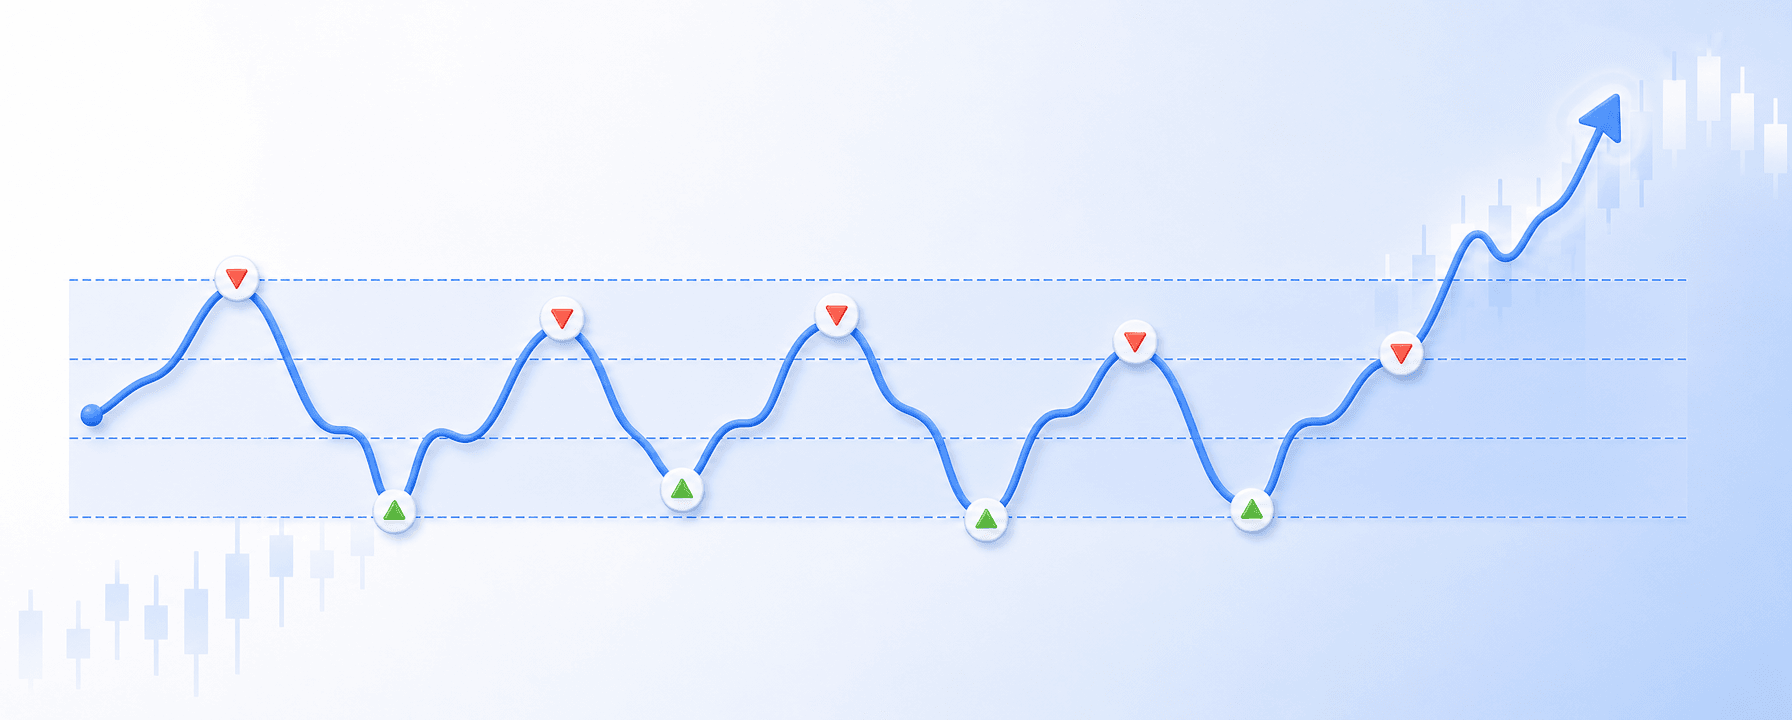
Range-bound behavior is observable when price repeatedly travels between established lower and upper boundaries rather than sustaining movement in one direction. Range-bound trading conventionally focuses on buying near support and selling near resistance, while a move above resistance or below support can end the range Mastering Range-Bound Trading: Strategy, Definition, and.... Editorial inference: this is the strongest fit for studying an unchanged grid because repeated crossings create opportunities for paired orders; it is the weakest fit once a breakout ends that pattern. Trending behavior is different: price develops sustained directional movement. Trend following waits for a trend to emerge and then follows it systematically Trend Following in Market Trading | PDF. Editorial inference: trending behavior is strongest-fit for a strategy deliberately designed to follow direction and weakest-fit for an unchanged bounded grid, because price may stop revisiting the levels needed to complete opposite-side orders. Leaving the range can halt new grid activity, leave inventory exposed to directional movement, or create opportunity cost while capital remains assigned to a stale structure. Exact behavior is implementation-specific. Bybit documents that its Spot Grid Bot pauses outside its configured range and resumes if price returns; that pause-and-resume rule must not be treated as universal or attributed to Cornix What is a Spot Grid Bot, and how does it work? | Bybit Learn.
Fees and execution quality
Evaluate a completed grid cycle after applicable execution fees, not from the distance between two levels alone Grid Trading Strategy Crypto: How Grid Bots Work in 2026. Kraken’s example fee framework applies a fee when an order executes, with the rate depending on factors including trading volume, pair, and maker-or-taker status How trading fees work on Kraken | Kraken. The applicable exchange schedule and order type therefore belong in the calculation for each filled leg. Grid spacing and costs interact mechanically. If the gross difference captured by a completed pair is small, two execution charges and any other applicable costs can consume much of it. If spacing is widened, price must travel farther before the opposite order completes. This is a tradeoff, not a universal spacing rule. The bid-ask spread is the gap between the highest bid and lowest ask. Slippage is different: it is the difference between the expected execution price and the actual execution price Understanding the Liquidity from your Order Book - Spread, Depth, and Slippage - BitMart. Order-book depth - the available volume at successive prices - affects how much an order can execute without reaching less favorable prices, so thin depth can reduce execution quality even when the displayed spread looks acceptable. Limit orders introduce another failure mode: touching the limit price does not guarantee a fill Understanding Limit Orders. Queue position and available opposing volume can leave an order open or partially filled. An automated log should therefore distinguish “price reached level” from “order completed”; otherwise a theoretical grid crossing can be mistaken for a realized cycle.
Monitor before judging results
Monitoring and low-commitment test framework
| Checkpoint | Observe | Pass condition | Failure branch |
|---|---|---|---|
| Bot state and orders | Bot status, active or open orders, completed or closed orders, error text, and timestamps. | Every expected order is accounted for as active, completed, or attached to an explained error state. | Stop the test if an order or state is unexplained; resume only after the record identifies the state and any applied correction. |
| Costs and fills | Fill price, amount, fee, partial or missing fill, and corresponding opposite order. | Each claimed cycle has two completed legs, and its result includes applicable execution fees. | Do not count the cycle when either leg, amount, fee, or opposite-order response is missing from the record. |
| Results | Realized grid profit, unrealized P&L, and total P&L as separate observations. | The decision uses total exposure and Total P&L, not realized Grid Profit alone. | Stop the evaluation until each displayed metric has a clear definition and the remaining position is included. |
| Demo observations | One ordinary order cycle and one awkward case, with the input, state change, fill status, fee, and resulting order response recorded. | The ordinary path is understandable, and every awkward state has an observed explanation; the demo result is not treated as proof of future results. | Revise the setup when an observed state cannot be explained; repeat the same case only after recording the resolution and applied change. |
| Historical test | Market period, assumptions, capital input, order rules, represented fees, and result. | The record is treated as evaluation against historical market data, not as live-execution evidence. | Revise or reject the test when its inputs or omitted live conditions are not explicit. |
The fields above are a transferable observation framework, not a claim that every interface uses the same labels. Bitsgap documents open orders, completed trade history, fees, profit, and unrealized P&L Analyzing Your GRID Bot’s Performance | Bitsgap. 3Commas documents active and closed orders, fees, P&L, duration, and bot status Grid Bot: Monitoring Tools | 3Commas Help Center. Bybit distinguishes Grid Profit from Total P&L: Grid Profit covers completed buy-sell pairs, while Total P&L includes realized and unrealized P&L FAQ - Spot Grid Bot - Help Center. A positive realized grid-profit number can coexist with negative total P&L when held inventory has an unrealized loss. That distinction prevents a common monitoring error: counting completed cycles while ignoring the current value of the remaining position.
A low-commitment study path
- State the hypothesis. Record the proposed boundaries, expected two-way crossings, and the requirement that completed pairs remain positive after modeled costs. Proceed only when each condition is measurable; otherwise revise the hypothesis.
- Build the separated test. Enter the intended range, grid count, spacing, and order size. Proceed when the displayed structure matches the test record; otherwise correct the mismatched input before restarting.
- Observe the order cycle. Record one crossing, fill, fee, state change, and adjacent-order response. Pass only when the order history accounts for every event; stop when a fill or replacement is missing or unexplained.
- Run an awkward case. Use a candidate limit price that the market reaches and record whether the order remains open, partly fills, fills later, or changes state. If the state is unexplained, identify the resolution, apply the resulting change, and then repeat the same case once.
- Judge the complete result. Compare realized grid profit, unrealized P&L, and total P&L. Continue studying the mechanism only when the order record, net-of-fee result, and total exposure support the original hypothesis; otherwise stop or revise the setup.
- Separate test types. Cornix describes backtesting as applying a strategy to historical market data; it is not live-execution evidence How to Use Cornix's Signals Bot BackTesting Feature | Cornix Help Center. Demo testing cannot prove future results, but it can expose operational assumptions before live use Crypto Asset Manager Trading Automation Across Accounts | Cornix. For the next review, open the Grid Bots, Demo Account, and Backtesting resources. Review the separate crypto bot risk-management guide before evaluating controls beyond the grid itself.
Note: Study a grid bot further only when repeated crossings, completed fills, net-of-fee cycles, understandable order states, and total P&L all support the same conclusion. If price behavior turns directional or execution records cannot explain the result, the next decision is to pause the grid hypothesis - not to treat more automation as the remedy.