Advanced Crypto Trading Strategies – from Zero to Hero (part I)
For those of you who are following our blog or just curious about actively trading cryptos, the concept of technical analysis should be familiar to you. This type of analysis wishes to identify current momentum and future market moves by examining chart patterns through analytical methods and tools.
Unlike fundamental analysis, which focuses on the foundations of a cryptocurrency, including its underlying technology and real-life use cases, technical analysis is aimed solely at finding trading ideas from the more dynamic database that charts and graphs offer. Except for blooming ROIs, the main goal of technical analysis is to get to a point where entering a position isn’t a shot into the dark but rather an educated prediction based on data.
In this series of blog posts, we’ll examine some of the most intriguing technical indicators available on the renowned TradingView platform. It is arguably the best open-sourced platform available today for the technical analysis of cryptos and many other types of financial assets.
While connecting the TradinView platform to different crypto exchanges is incredibly easy through our advanced TradingView Bots, mastering all of the advanced features and options this platform offers might be overwhelming, even for the most experienced traders.
Our goal is to provide you with a specific toolkit by the end of this blog series that will give you a better idea of how to harvest the full range of capabilities from this analytical charting platform to become a successful crypto trader.
In this first blog post, we’ll embark on our journey to master technical analysis by exploring arguably one of its most useful foundations: the moving average. By the end of this piece, you’ll know exactly what it is, why it is so important, and some practical and reliable ways to use it.
Last thing before we move forward: Please remember that all the information in this blog is solely for educational purposes and shouldn’t be considered financial advice. Trading cryptos is complex, and while technical indicators can be helpful tools, they are not bulletproof. Consider your risk tolerance, financial situation, and trading goals before making any financial decision, and above all, trade responsibly.
Now that we have everything covered let’s begin!
Averages on the Move
An average price is a value derived from the calculation of the mean price of an asset over a defined period. In traditional markets, the most common way to calculate an average price is to add up a security's opening or closing prices and divide it by the number of days under exam. In the crypto markets, opening and closing prices are literal values that don’t exist. Traders usually use the mean price of the chosen timeframe instead.
In the world of technical trading, this average calculation, meaning an average that constantly updates itself as new market data pours in, is not referred to as an average but rather as something more dynamic—the moving average, or MA for short.
Different Kinds of Moving Averages
In technical analysis, the term moving average doesn’t refer to simply one value but a whole family of statistics. Generally speaking, the three most common methods to calculate the moving average as part of technical analysis are - the simple moving average, the volume-weighted moving average, and the exponential moving average.
The Simple Moving Average
As its name suggests, the simple moving average, or SMA in short, is the most straightforward way to calculate a moving average. In many cases, MA and SMA are synonyms, as they refer to the basic method to determine an average, which is dividing the cumulative price of an asset by the number of timeframes you wish to calculate.
In other words, if we wish to calculate the SMA for the past ‘n’ number of periods, the formula is:
SMA(n) = (total sum of median prices over ‘n’ periods) / n
For example, if you wish to calculate the seven-day SMA, all you need to do is sum up the median price for each day over the past week and then divide it by the number of trading periods you’re examining, in this case, seven.
SMA(7) = (total sum of median prices over the last seven days) / 7
The Volume Weighted Moving Average
The volume-weighted moving average, or VWMA in short, is a type of weighted moving average where bigger weights are added to the formula for high-volume data points and smaller weights for times when volumes are lower. The logic behind this way of calculating is that, at least in theory, price changes that are supported by relatively high volumes should be more meaningful than price movements that occur when trading volumes are low and market prices are set according to only a small number of trades. The VWMA and the SMA usually present similar results when trading volumes are relatively stable.
To calculate a WVMA, multiply each price measurement with its matching trading volume and sum them together. Then, divide this cumulative sum by the total trading volume for that same period of time. This, in turn, will give a different variation of a moving average, which puts more emphasis on high-volume trading periods than on trading periods with lower volumes.
The formula for calculating the VWMA is as follows:
WVMA(n) = (P1 * V1) + (P2 * V2 ) + …(Pn * Vn) / V1 +V2…+Vn
- p = median price for each trading period (usually daily median price)
- v = trading volume for each trading period
- n = the number of trading periods under exam (the WVMA length)
The Exponential Moving Average
The exponential moving average, EMA for short, is also a weighted moving average designed to give traders a more precise grasp on market conditions by emphasizing (theoretically) more relevant data.
In the case of the EMA, bigger weights are given to more recent data, while smaller weights are assigned to older data points. This un-symmetric calculation method makes the EMA more sensitive to price changes since new price action affects the sum value more than past performances. For this reason, many traders, especially daily ones, find the EMA more valuable than the SMA, as it is more susceptible to current market conditions, thus bringing a more accurate reading of real-time market conditions.
Since the formula to calculate this kind of moving average is more complicated than the other variations we’ve discussed and less intuitive to understand, coupled with the fact that these calculations are automatically provided by the advanced charting tools of the TradingView platform, we won’t go into too much unnecessary detail about it. As long as you understand the logic of it, as well as the reasoning behind it, we can move forward safely.
Wrapping Up the Moving Average
Let’s sum up before we proceed. So far, we’ve learned about the difference between static and moving averages and discussed the three main types of moving averages.
While all of these moving averages are similar and essentially used for the same reason, that is, mitigating price fluctuations and other abnormalities over a given period of time, their differences give us a different perspective on current market conditions and upcoming trends.
As we’ll see later, these statistics are often used in the same ways or even in the same formulas. While it is tempting to declare one method as the best, it’s impossible. Instead, it’s better not to view them as rivals but as complementary statistical values that collectively present traders with a wholesome and fairly accurate picture of where prices currently are and where they are expected to go next.
Trading Strategies with Moving Averages
As we briefly mentioned, the different variations of moving averages give us a clue as to whether current prices are relatively high or low compared to previous market data. Short-moving averages are generally used for managing short-term trades, while long-term moving averages are considered more suited for positions with a longer timeframe.
Another way of looking at it is that longer moving averages deliver more accurate signals at the cost of missed opportunities. At the same time, shorter-termed MAs bring more trading signals overall, but a higher percentage of them might be false alarms.
That said, moving averages alone don’t mean much to traders and present limited ways to act upon them solely. This is why many traders often refer to them as a statistic rather than an indicator. Their power lies in their utilization of other calculations and formulas, which, in turn, can produce some of the most reliable indicators in technical analysis.
Without further ado, let’s look at two of the most straightforward yet powerful trading indicators and how traders can explore different ways to adjust them to different assets through the features of the SMAs, EMAs, and WVMAs variations.
The Golden Cross
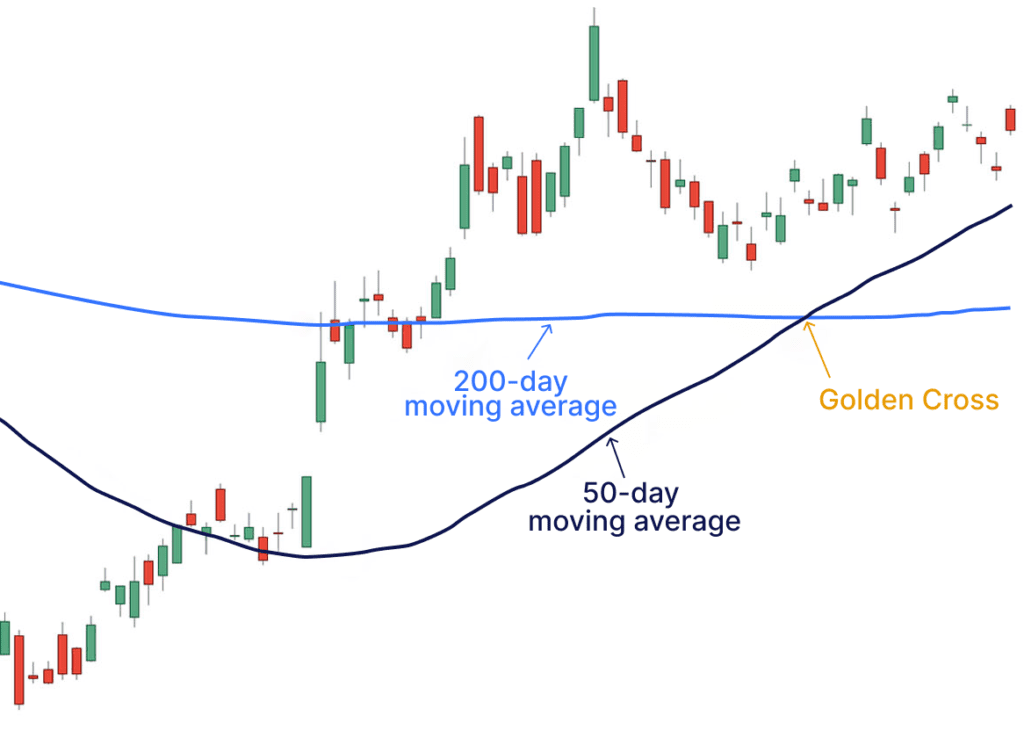
The golden cross is a chart pattern that informs traders about the current momentum of the markets. From a technical analysis perspective, it occurs when a relatively short-term moving average crosses a longer-term moving average over and above.
In other words, as market prices increase, the shorter MA, which inherently reacts faster to price changes, rises accordingly until, if the movement is meaningful enough, it crosses the longer, less sensitive MA, thus creating a buying signal. This bullish indicator symbolizes prices forming an upward trend and gaining positive momentum.
The classic configuration for the golden cross indicator uses the 50-day SMA as the short-moving average and the 200-day SMA as the long one. In general, when longer periods of moving averages cross one another upwards, it’s considered a signal for forming a long-lasting bull run. With that, since longer SMAs are less prone to changes than shorter ones, using the common 50- and 200-day moving averages might have a lagging effect, which means traders could miss out on a substantial amount of the uptrend before this indicator would create a buying signal.
This is why many day traders and other short-term investors use shorter-term moving averages, like 7 or 14 days. This enables them to capitalize on more subtle golden cross breakouts. Another popular implementation of the golden cross is to use VWMA instead of SMAs since high trading volume usually reinforces the accuracy of this indicator.
The Death Cross
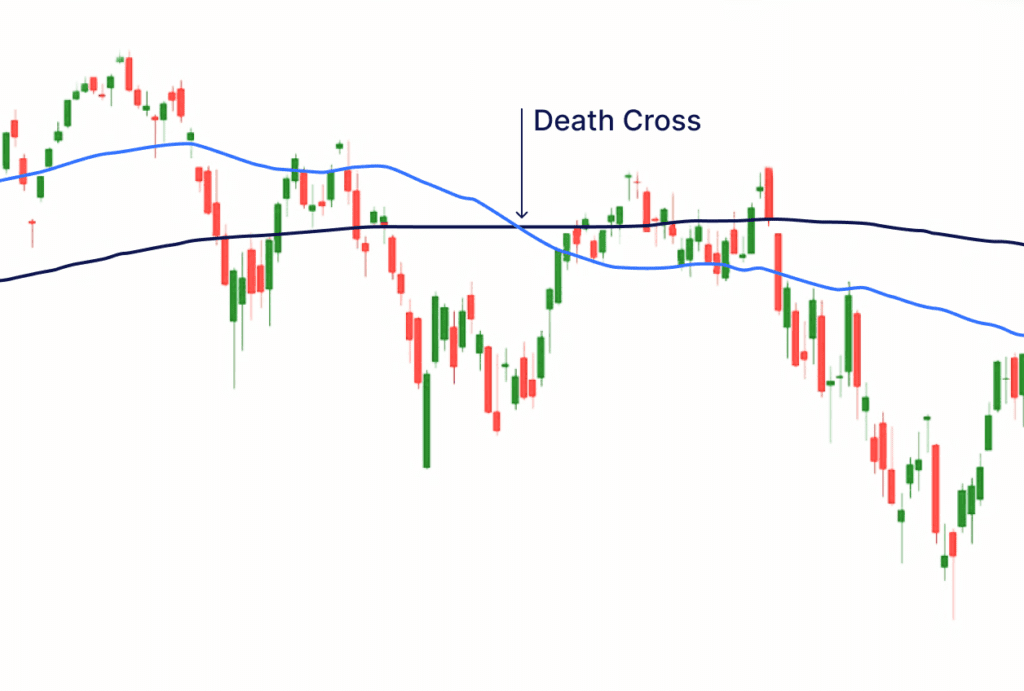
On the contrary, the death cross, while also being a momentum indicator that follows the same logic, symbolizes the complete opposite for traders. Another way of looking at it is as a mirror image of the golden cross, where instead of an upward crossover, this time, the short-term SMA is crossing the long-term SMA downwards.
It occurs when market prices decline, and the shorter, more sensitive moving average deteriorates until it falls below the longer, more stable SMA. With the same underlying logic as the golden cross, the death cross is a bearish indicator that triggers a sell or short trading signal.
The 50- and 200-day death cross in traditional markets has an impressive track record. It has successfully predicted all major bear markets in modern history, including the last one, the 2008 financial crisis.
With that being said, in many cases, the appearance of the death cross doesn’t necessarily indicate the start of a long bear market but rather a less dramatic price correction. This is why many seasoned traders use shorter-term EMAs, which are more dynamic. This enables traders to exploit the full movement of these price fluctuations.
Support and Resistance
The different variations of moving averages can also signify a cryptocurrency's current support and resistance levels. Crypto traders often use these levels to determine the ideal settings for their stop-loss and take-profit parameters.
If the crypto price is trading down and starts approaching its relevant moving average, this MA tends to act as a support level that prevents prices from falling further. A common trading method is to set up a stop-loss around that price mark since a price decrease under that level can indicate a significant downtrend is likely to occur.
Conversely, if prices are rising toward their moving average, this MA often functions as a resistance level that blocks prices from going upwards. In this case, the resistance level is often used to set a take-profit goal since a significant increase in price above that level is less expected to happen, at least in the short term.
Like before, the traditional configuration for this indicator is most useful in meaningful MA lengths, like 100-day or 200-day moving averages, daily, or other short-term traders can choose shorter time frames that would be more relevant and beneficial for them.
Useful Tips for (Average) Moving Forward
As you’ve probably realized by now, moving averages, specifically the relationship between them, can be a powerful data resource for traders, helping them determine the entry and exit points for their trades and positions.
While using common values of moving averages in a calculation has its fair share of benefits, traders shouldn’t be afraid to explore and examine other less conservative timeframes that might deliver better results.
In addition, while the classic way to configure a trading signal is to use the same type of moving average across the board (usually SMAs), mixing up different kinds of moving averages (for example, setting up a long SMA with a short EMA) has the potential to bring something unique to the table that could result in attractive outcomes.
Remember that it’s very likely that different moving averages (or any other indicator) could be more accurate for certain cryptocurrencies while others might give a more accurate reading. Furthermore, it is also possible that an MA-based indicator that was very accurate initially might become unreliable later on, and vice versa.
The point is that traders with access to optimization tools like back-testing and paper trading shouldn’t be afraid to think outside the box, explore new ideas, and hopefully independently develop reliable technical indicators that can generate relatively stable profits. Equipped with the right knowledge and technology, this process can be less intimidating and, some might say, even interesting and fun.
Moving On from Moving Averages
The SMA, EMA, VWMA, and trading strategies based upon them are just a few of the almost unlimited selection of statistics and indicators experienced traders use in their technical analysis process.
In this blog post, we’ve mainly focused on a few of the most basic yet popular indicators for determining the whole setup of a trade: an entry point, an exit point, and price marks for stop-loss and take-profit. Stay tuned for our next part, as we’ll explore more advanced technical indicators and concepts for identifying trading opportunities, support, resistance lines, and overbought/oversold territories. It is going to be very interesting!
Related Articles
Finding the Best Trading Bot for Your Crypto Strategy
Unveil the potential of crypto trading with our comprehensive guide on trading strategies and the best trading bots in 2024.

Day Trading Crypto - Ultimate Guide for Beginners
Dive into the dynamic world of crypto day trading with this essential guide. Learn the top strategies and tools to start trading like a pro today!

Bitget and Cornix Announce a New Partnership
Bitget and Cornix announce a powerful integration, offering advanced automated trading tools and seamless connectivity to enhance trading efficiency.